Data Driven Presentation
TISGraph has some functionality for data driven presentation, i.e. the depiction of data points depending on certain properties of said data points. Both general properties and data point specific properties must be delivered in the form of metadata by the data source (which, on a technical level, is parsed by an adapter) Data point dependent display parameters can be used for graphs and tables.
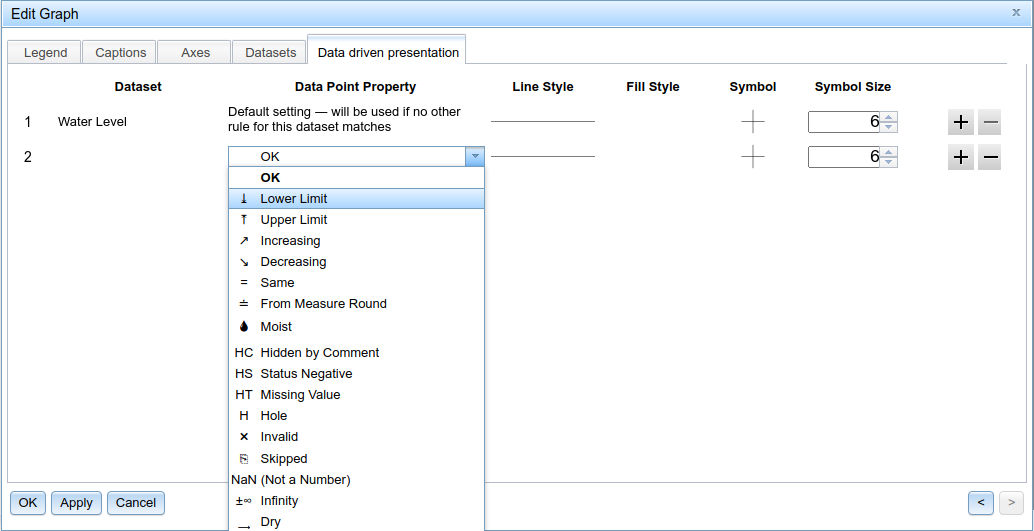
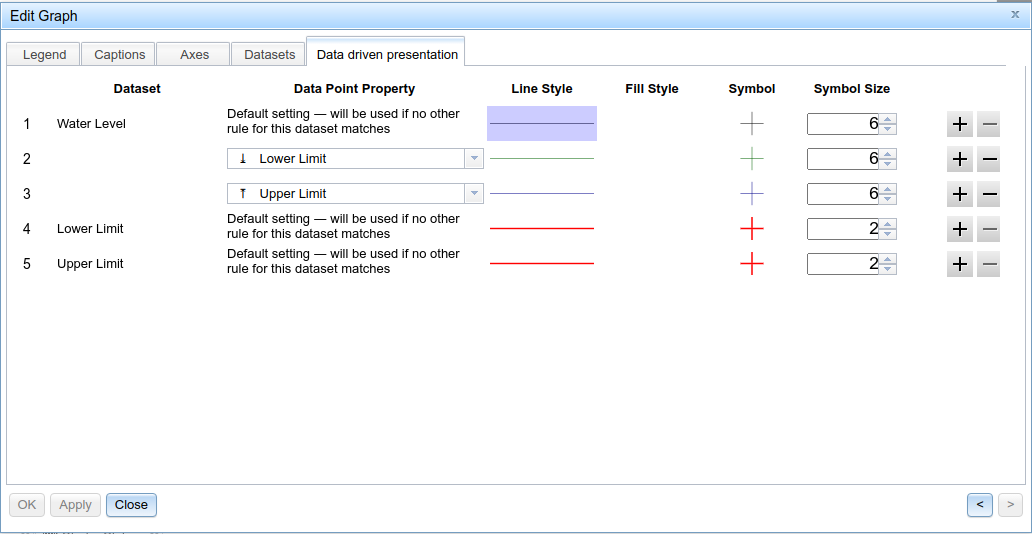
For example, consider this example of a MDA data source. By setting the upper and lower boundary, you can evaluate dynamically generated statuses: Under Edit → Data driven presentation, you can add these limits to the graph via the "+" button:  You can set individual style properties suc hash stroke style and filling for each of these properties:
  The upper and lower limits are now shown in the graph.
MDA Data Source
The MDA Adapter can transmit static and also dynamically generated statuses and properties when processing data requests or calculations.
MDA delivers these static statuses / properties
- INVALID - The value is invalid (e.g. unknown import status)
- SKIPPED - nothing was measured
- NAN - not-a-number (division by 0)
- INFINITY - Infinite value
*MDA delivers these dynamically generated statuses / properties
- CHOSEN_LOWER_LIMIT - The time series' lower limit was undercut
- CHOSEN_UPPER_LIMIT - The time series' upper limit was exceeded
- VALUE_INCREASING - The previous value was smaller
- VALUE_DECREASING - The previous value was bigger
- VALUE_SAME - The previous value is identical to this one (at the moment, small floating point derivations are possible - no epsilon is being used)
- FROM_MEASURE_ROUND - Value was gathered in the context of a measure round (meaning, by hand)
Vivavis/EVN specific statuses / properties
- OUT_OF_ORDER - usually blocked manually
- UNUSABLE
- IMPLAUSIBLE
- LOWER_LIMIT_VIOLATION - boundary violation detected by SCADA
- UPPER_LIMIT_VIOLATION - boundary violation detected by SCADA
- LOWER_LIMIT_WARN - currently not being used
- UPPER_LIMIT_WARN - currently not being used
WISKI-DB Data Source
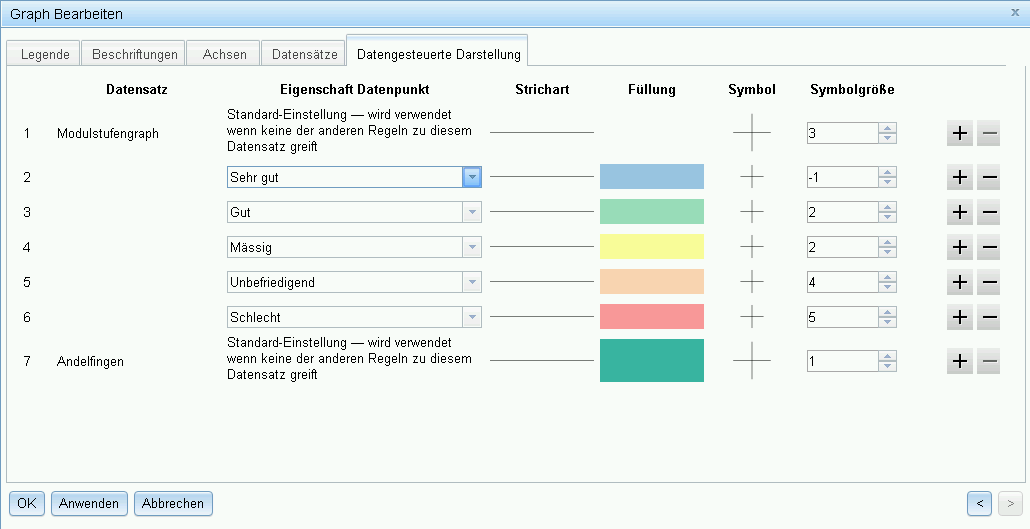
Data provided by WISKI data sources typically contains quality statuses for usage in data driven presentation.
Mit WISKI als Datenquelle kann typischerweise der Qualitätsstatus der Daten für die datengesteuererte Darstellung verwendet werden. 