MDA2 GUI
Login

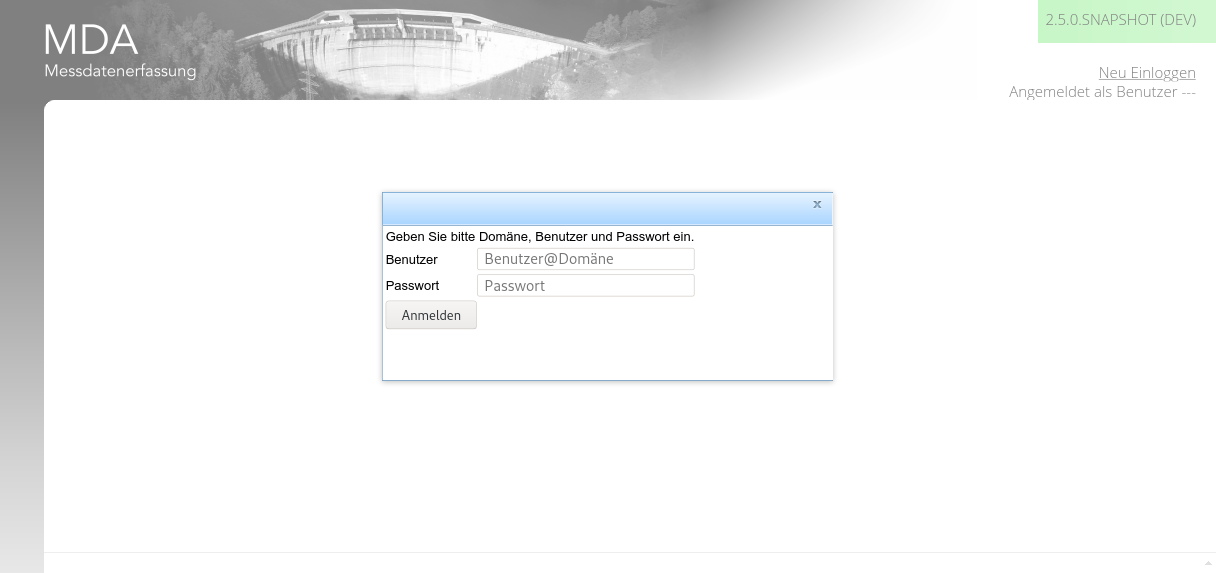
At the start of the application, you need to authenticate yourself as an authorised user. There are several implemented ways, this screen shot demonstrates the user/pass one.
Main GUI

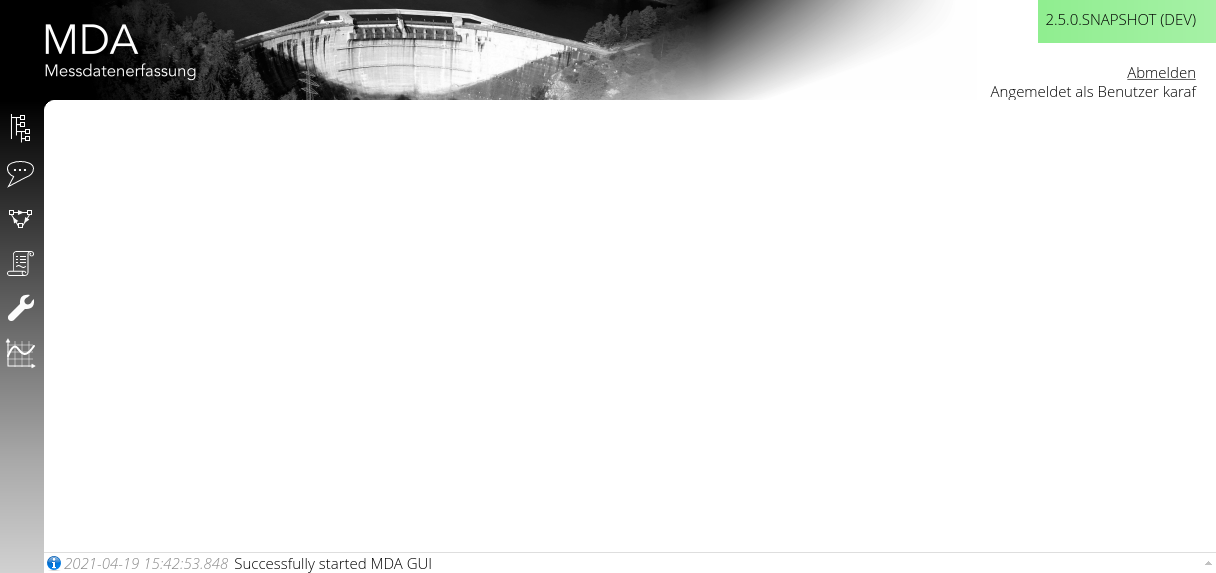
In the main window, on the top right hand side, you have:
- the version information (the color depends on the stage; production is white)
- you can log out (if the authentication method allows for that)
- you can read your login information
In the main window, on the bottom, you have:
- a log message pane where log messages (info, warn, error) are shown.
- You can click on the pane and get an history of the latest messages.
In the main menu, on the left hand side, you have:
- a menu bar for the authorised functions
Graphs
The graphs of MDA are configured and generated in TisGraph.
Time to Value graphs utilizing many aggregating functions and configurations
- (aggregated) Values
- Min/Max
- Min/Avg/Max
- Bar
Box-Whisker graphs
Parametrized graphs are those with x and y being both time series values only ordered in time.
Georeferenced images and Geo-Graphs
Monitoring
Aside from the server and middleware monitoring, we have added a monitoring page which you can download as JSON as well.
Reference Clients
- EVN (MDA2)